Safe city | 30 September 2022
How can data help smart cities achieve Vision Zero?
As the global population increases, the demand for efficient transport will also increase. And with this all modes of transportation must be as safe as possible to meet the set targets.
When striving to minimise road accidents, injuries and fatalities, it's important to understand how and where changes can be made to make road use safer. However, gaining that understanding can only be done with detailed data, including visual data, that can guide the right decisions about road transport now and in the future. This is especially important as countries worldwide pursue the ultimate goal of Vision Zero.
This blog will explore how Vision Zero works in practice and the current trends in road safety and smart mobility. We'll also discuss data's vital role in the years ahead.
What is Vision Zero?

Vision Zero is an international project for road safety with the long-term aim of eliminating all deaths and serious injuries on our roads. The European Union, for example, has set the target of reducing the rate of fatalities and serious injuries to zero by 2050.
The concept of vision Zero was first developed in Sweden in the mid-1990s. The Swedish parliament was the first legislature to formally approve and support the idea in 1997. Since then, the annual number of fatalities on Swedish roads per million people has dropped substantially, from 61 per million in 1997 to 27 per million in 2013.
Over the first two decades of the 21st century, several other countries and transport bodies have adopted the Vision Zero concept. But because their demographics, road characteristics and fatality rates vary, the measures they have put in place can often differ substantially. For example:
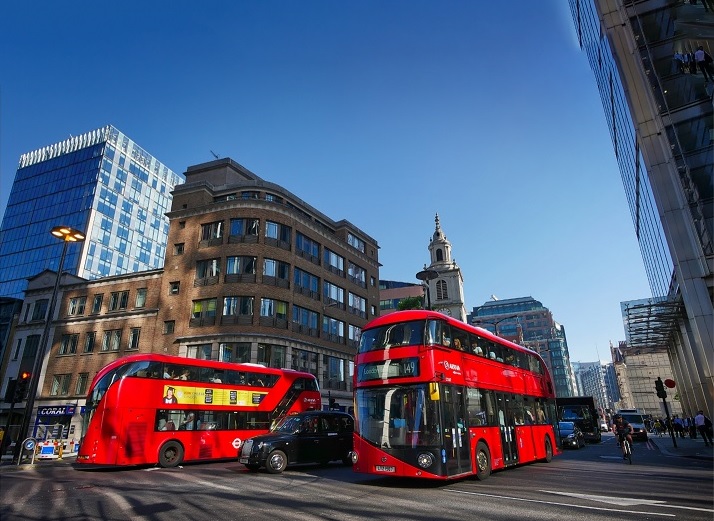
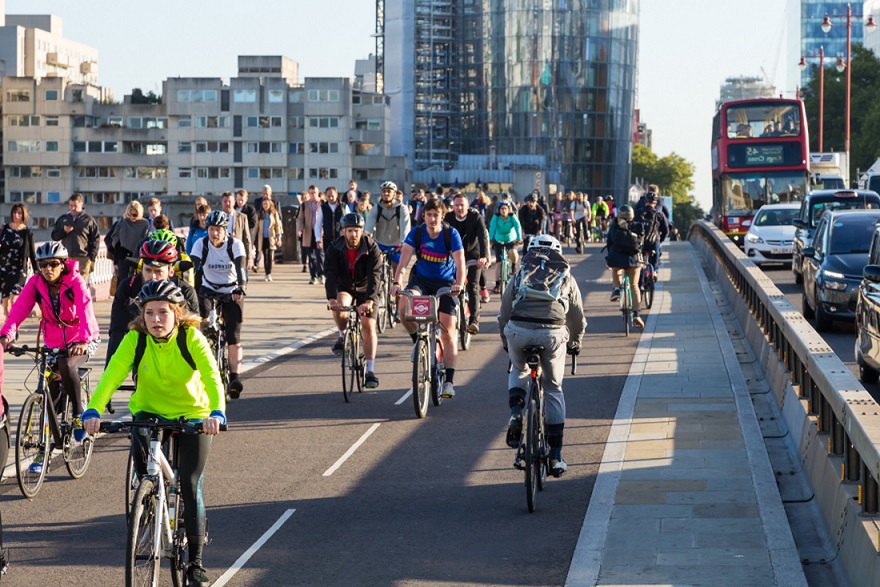
- In central London, known for heavy traffic and high rates of cycling, Transport for London reduced the speed limit for all roads in the city centre from 30mph to 20mph in 2019
- In 2019, the Norwegian capital Oslo successfully reduced the pedestrian and cyclist fatality rate to zero, helped by a range of measures including fencing that promotes safer road crossings
- In the Netherlands, the safety approach has focused on 'self-explaining roads', where the assumption is made that people are the cause of most accidents and clear and simple roads make it easier for road users to navigate.
What are the emerging road safety trends around Vision Zero?
As the above examples demonstrate, there are many different trends and initiatives that can be explored as part of a Vision Zero project. But speaking generally, most efforts can be grouped into one of five areas:
- Engagement: ensuring fatalities are minimised needs everyone involved to play their part and form collaborative and productive relationships to promote projects and initiatives. This should include government and politicians, transport experts, technology providers, public health bodies, law enforcement and the wider community.
- Data analysis: exploring the insights within data to understand trends in traffic levels, accidents, and road use, including how traffic can impact some population demographics more than others. This way, better, data-driven decisions can be made.
- Speed management: reducing speed limits to safe and appropriate levels for the environment, including in mixed-mode areas where vehicles, cyclists and pedestrians share the same space.
- Autonomy: the more widespread adoption of autonomous vehicles, designed with crash prevention as one of their core functions, reduces some elements of human error or fatigue from accidents.
- Target setting: committing to a specific deadline to reach the target of zero deaths or serious injuries can focus organisations on the task at hand and ensure they are proactive in addressing the issue sooner.
How can visual data and analytics help to achieve Vision Zero?
Data analysis is possibly the most important of the five areas listed because it allows for a more proactive approach. For example, instead of spotting where accidents occur and then making changes retrospectively, data can identify where changes can be made before any potential accidents take place.
The data involved needs to be up-to-date and detailed to make this possible. For example, suppose a pothole has developed on a particular road and is getting bigger. In this case, maintenance crews and city planners need to know its status in real-time to get it filled in before it becomes a problem. As bad weather and road wear can lead to a pothole getting much bigger in a very short time, this can be particularly dangerous for cyclists and drivers who try to swerve around it. So, a rapid response is crucial.
The best way to get this level of timeliness and detail from data is through a visual approach. Visual data can give a real-time view of every single piece of the road environment: signage, streetlights, trees and road furniture, along with sensor-driven data like traffic rates and speed information.

Furthermore, this data can be updated constantly, in absolute real-time, so relevant managers have the most up to date picture of a road's situation and use many different data points to identify potential hazards or accident hot spots.
What's more, this visual data can all be accessed remotely online. This means that maintenance crews don't need to spend time physically inspecting areas that need attention, helping repairs and changes to be planned and executed more quickly.
Vision Zero for the smart city era
As cities get smarter and more connected, the potential to use technology and visual data to pursue Vision Zero is only increasing. It's something that we at Cyclomedia have covered in our recent report: "The Future of Transport and Road Safety in Smart Cities. 9 trends that will revolutionise mobility by 2050."
In the report, you'll be able to read about the views of five leading experts in road safety and smart mobility and explore the current challenges around road safety. Along with more detail on how visual data can help. Our experts also give their own views on the trends that will shape transportation and road safety in the future, including:
- The need for flexibility and sustainability across all modes of transport
- How shared ownership and autonomous vehicles will change our relationship with road-based transport
- Why space should be about people more than traffic and cars
To read the report in full, click on the link below.
